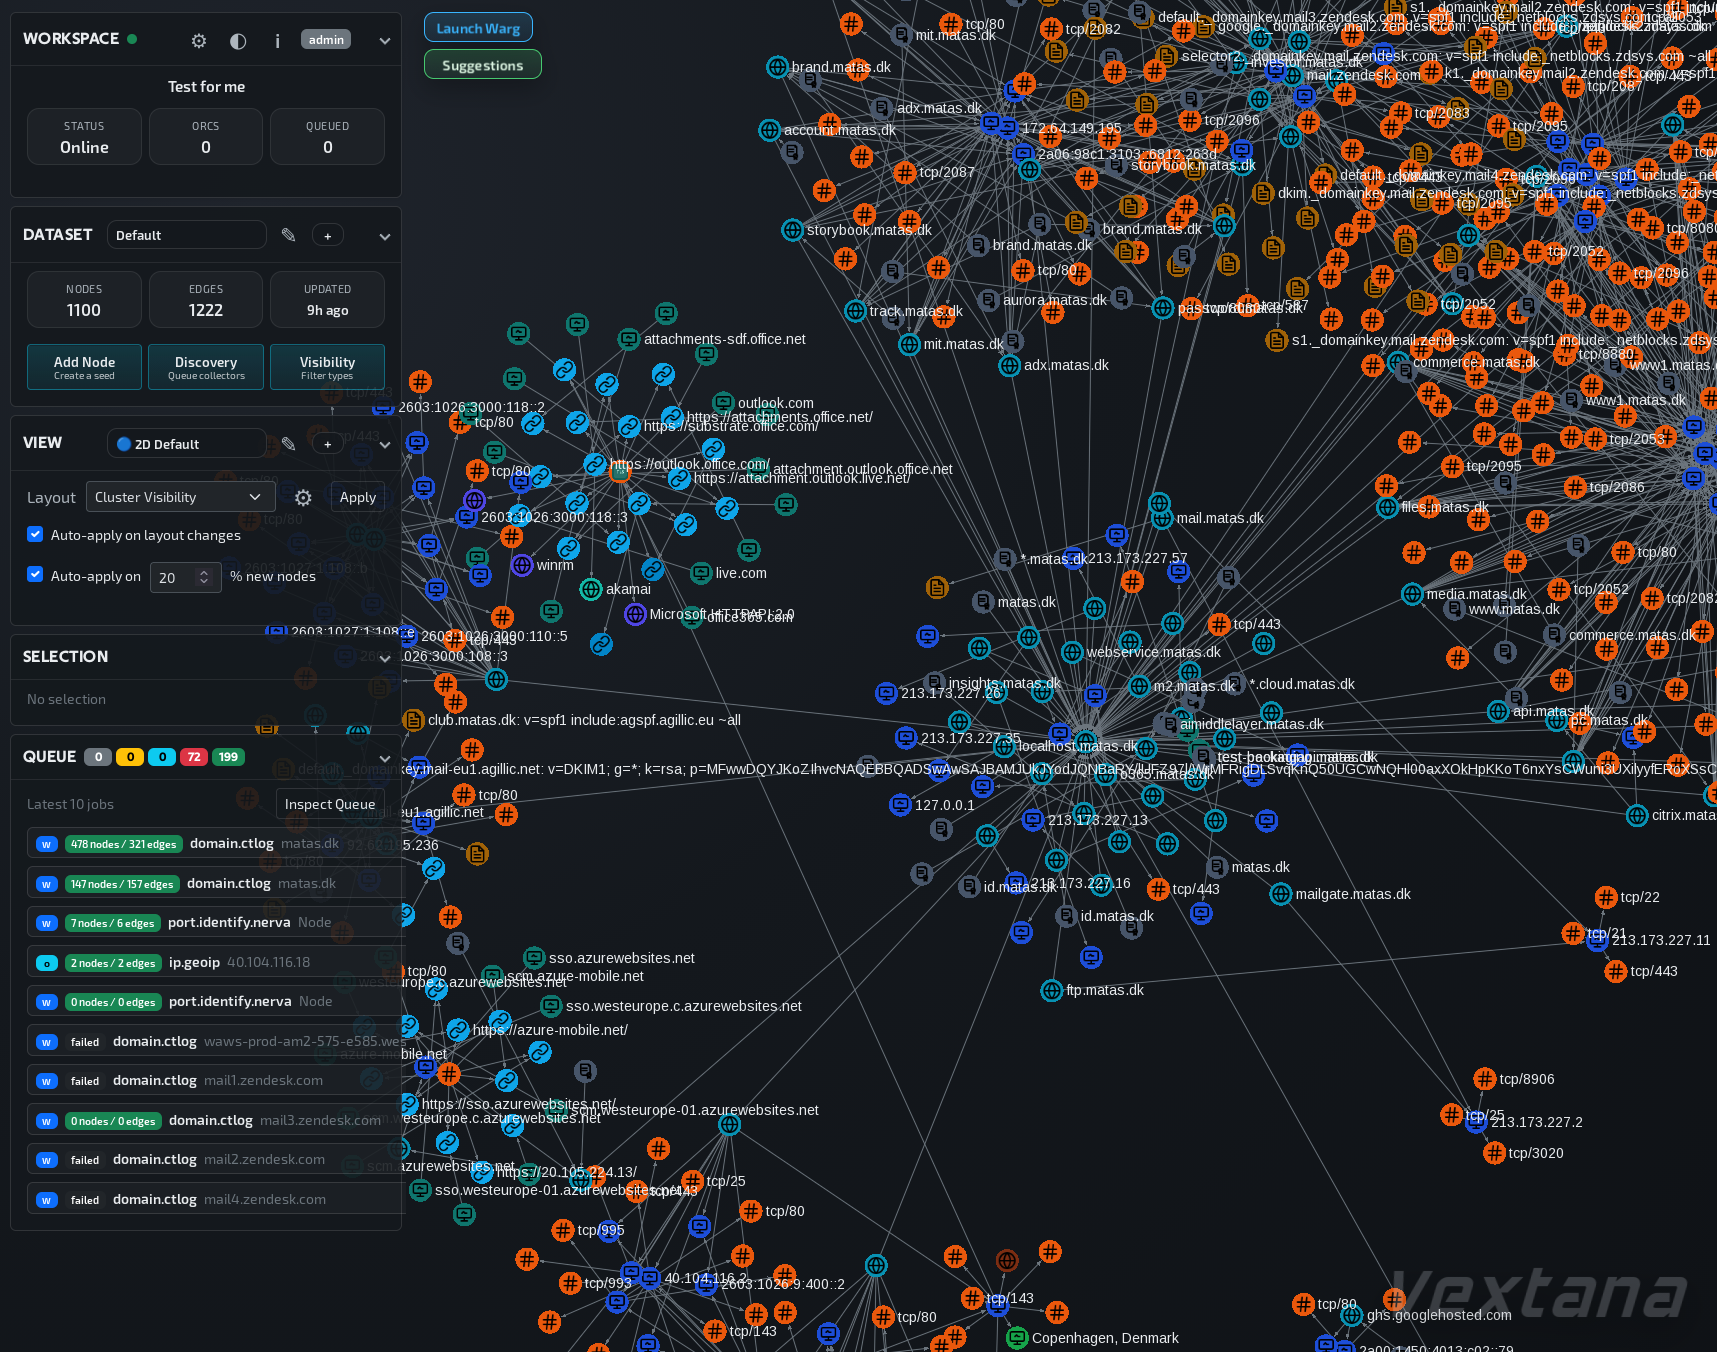
Graph first
The graph is the operating surface, not an export target after the real work already happened somewhere else.
The problem
Vextana turns domains, hosts, URLs, repos, usernames, companies, and other entities into one graph workspace you can expand, interrogate, and keep organized as the graph grows.
It keeps pivots, collector output, and graph context in one place instead of scattering them across tabs, notes, and disconnected tools.
Why it exists
The graph is the operating surface, not an export target after the real work already happened somewhere else.
Expansion is grounded in concrete pivots across infrastructure, web content, code, identities, and organizational artifacts.
One long-lived workspace can hold multiple datasets so graph work stays separated without fragmenting your operating context.
Workflow
Seed. Expand. Operate. All driven with an intuitive user interface.
Drop in a domain, host, IP, URL, repo, username, company, or other entity and treat it as the root of a graph, not a row in a table.
Vextana is designed around collector-driven pivots: DNS, passive infrastructure, website analysis, code search, certificates, identities, trackers, cloud buckets, business registries, and more.
One durable workspace can hold multiple datasets, preserving context while letting you separate threads, snapshots, or hypotheses cleanly.
Coverage
DNS, RDAP, passive DNS, certificates, ASN and netblocks, exposed services, ports, reverse DNS, and cloud buckets.
Website crawling, headers, scripts, links, analytics IDs, tech stack, text extraction, trackers, and archived web history.
Repo dependency pivots, code search, usernames, social profiles, email enrichment, company records, and knowledge-source expansion.
Use cases
Map domains, hosts, IPs, services, certificates, and netblocks into one working view.
Follow infrastructure relationships without flattening them into disconnected lookups.
Pull websites, scripts, trackers, links, and archived content into the same graph.
Keep page structure and external references tied to the entities they came from.
Expand from usernames, emails, repos, and profiles into related accounts and artifacts.
Move between technical and human signals without switching tools or losing provenance.
Keep separate datasets in one workspace when a graph needs to stay useful over time.
Return to the same context later without rebuilding the structure from scratch.
Next step
If your work starts with one indicator and turns into a connected story across domains, services, websites, identities, repos, and organizations, this is the operating model.
Start exploring